Performance Marketing
Best-in-Class Retail Media Data Analytics
Consistent Ongoing Campaign Auditing


Customized Retail Media Analytics Reporting
Driving Growth Across Multiple Platforms

Driving Growth Across Multiple Platforms
Succeeding and scaling your business in today’s competitive digital marketplace requires coordinated growth across multiple platforms simultaneously. It’s not just about being present, but about being effective everywhere your customers are. That’s where we come in. We simplify the complexity of multi-channel ecommerce by aligning tailored strategies that work in harmony to enhance your online presence, performance, and profitability. Whether it’s Amazon, Walmart, Instacart, or other emerging marketplaces, we develop and execute platform-specific campaigns designed to meet the unique algorithms, shopper behaviors, and competitive landscapes of each. Our experienced team ensures that every strategy is purposefully built and performance-driven. To give you clear visibility and actionable insights, we consolidate data from all retail media platforms into comprehensive yet easy-to-understand analytical reports. These reports spotlight trends, highlight key opportunities, and identify areas for improvement, empowering you to make informed decisions that drive continued growth and long-term success.
Utilizing Pacvue to Drive Retail Media Analytics

Utilizing Pacvue to Drive Retail Media Analytics
At Brandwoven, we utilize Pacvue API to digest ecommerce data and streamline the process of analyzing and interpreting complex retail media metrics. Pacvue provides comprehensive, real-time insights into performance across marketplace platforms and campaigns, enabling precise adjustments to strategies, ad spend optimization, and overall improved advertising effectiveness for greater brand growth and sales.
Advancing Performance Through Pacvue AI and Automation
Brandwoven’s marketing team stays actively engaged with Pacvue’s latest AI and automation capabilities to ensure our strategies remain current, scalable, and performance-driven. Through ongoing Pacvue training, our team continues to deepen its understanding of how to effectively launch, manage, and guide automation across complex retail media campaigns.
As accounts grow more competitive and campaign structures become more sophisticated, automation allows us to streamline workflows, reduce manual adjustments, and make faster optimizations at scale. Pacvue’s algorithms can manage the granular campaign adjustments that are difficult to execute manually, helping improve efficiency while our team stays focused on strategy, oversight, and knowing when to step in.
This combination of advanced technology and experienced human guidance allows Brandwoven to help our brand partners move faster, compete more aggressively, and make smarter performance marketing decisions across marketplaces.
Tracking Share of Voice for Growth Insights
Tracking Share of Voice for Growth Insights
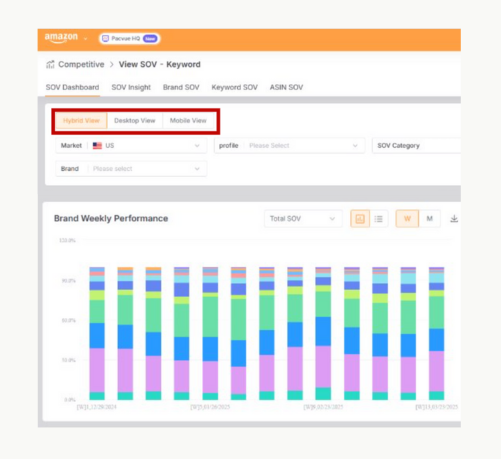
Share of Shelf/Total SOV represents a percentage of a brand’s organic and paid placements against all available placements on a given search query. Paid SOV is a percentage of a brand’s paid placements against all available ad spaces on a given search query.
Since SOV is a percentage, a keyword’s search volume can drop from 40,000 to 4,000 while SOV stays steady.
We track SOV by selecting specific keywords that represent a market for a given product/brand or a market that a product/brand would like to grow in. This is usually separated by Product Category and by Target Type between Branded/Generic/Competitor. We can look at desktop traffic, mobile traffic, or both combined.
We never show SOV data for only one keyword, provide SOV data for a period smaller than 30 days, or pull insights from SOV without also looking at applicable marketing KPI’s for the tracked keywords; we provide clients with the full picture. We look deeply into SOV breakdowns for our clients, providing a complete list of competitor brands and the ability to sort by KPI to ensure that key marketing data is readily available.
Frequently Asked Questions
What strategies can be used to improve ROAS/ACoS?
First we need to determine what a healthy ACOS/ROAS is given your business and goals. Once a healthy ACOS/ROAS level is determined, we go to work custom building a campaign structure that works for your needs and delivers results. However, ACOS or ROAS might not be the best KPI to optimize for depending on what your ecommerce goals are!
What metrics should track success if not ROAS/ACOS?
Are you a new player in a category striving for market growth or have you conquered your category and looking to hold your position? Either way, it’s never one KPI that tells the whole story. Whether it be DPVR, CVR, or T-ACOS, among others, we will help identify what indicators give the best feedback to ensure we are on the tract to success.
How do I access all the data that is being tracked?
Aside from the reporting schedule where you will meet with our marketing team, we provide access to dynamic, secure, and interactive dashboards via our API partner Pacvue. You will be able to see up to date reporting at any time.