Ecommerce marketplace brands know that mastering data analysis is crucial for understanding performance and driving growth. But the goal of this data analysis is to identify the root causes of fluctuations in ecommerce sales performance and to decide the most impactful next steps for improvement. Even when sales grow, your brand must know why to be able to double down on what’s working and maintain that strong performance long-term. In this article, we’ll discuss:
- How to analyze marketplace performance through various metrics: Determining the “what” and “why” of changes
- The 3 primary drivers of fluctuations in marketplace performance data
- The best tools to leverage for ecommerce marketplace performance data analysis
- How to use analytics to guide actionable strategies for your brand
Step 1 of Ecommerce Marketplace Data Analysis: Identify the “What”
Once you notice a fluctuation in your marketplace performance, determine which data warrants attention. From there, you can identify the metrics that are most important to your brand’s success. For example:
- Look at Ordered Revenue to see which products are driving sales
- Look at Average Selling Price (ASP) to understand product cost
Identify where things are going well and where they are struggling, noting what raises concerns versus achieving goals.
To understand issues more in depth, break down your marketplace data into digestible chunks. Dig down to the category, sub-category, or ASIN level as needed.

Step 2 of Ecommerce Marketplace Data Analysis: Identify the “Why”
Once you know “what” happened with your data, the next step is to determine “why”. Knowing what happened and what the change was impacted by is crucial to ensure your strategy remains aligned with your overall marketplace goals.
Changes in marketplace sales performance can typically be broken down into three major categories or primary drivers:
3 Primary Drivers of Marketplace Sales Performance
Understanding these 3 primary drivers allows you to pinpoint factors influencing your marketplace performance. Use your data and hypotheses to identify the root cause of change within each of these drivers.
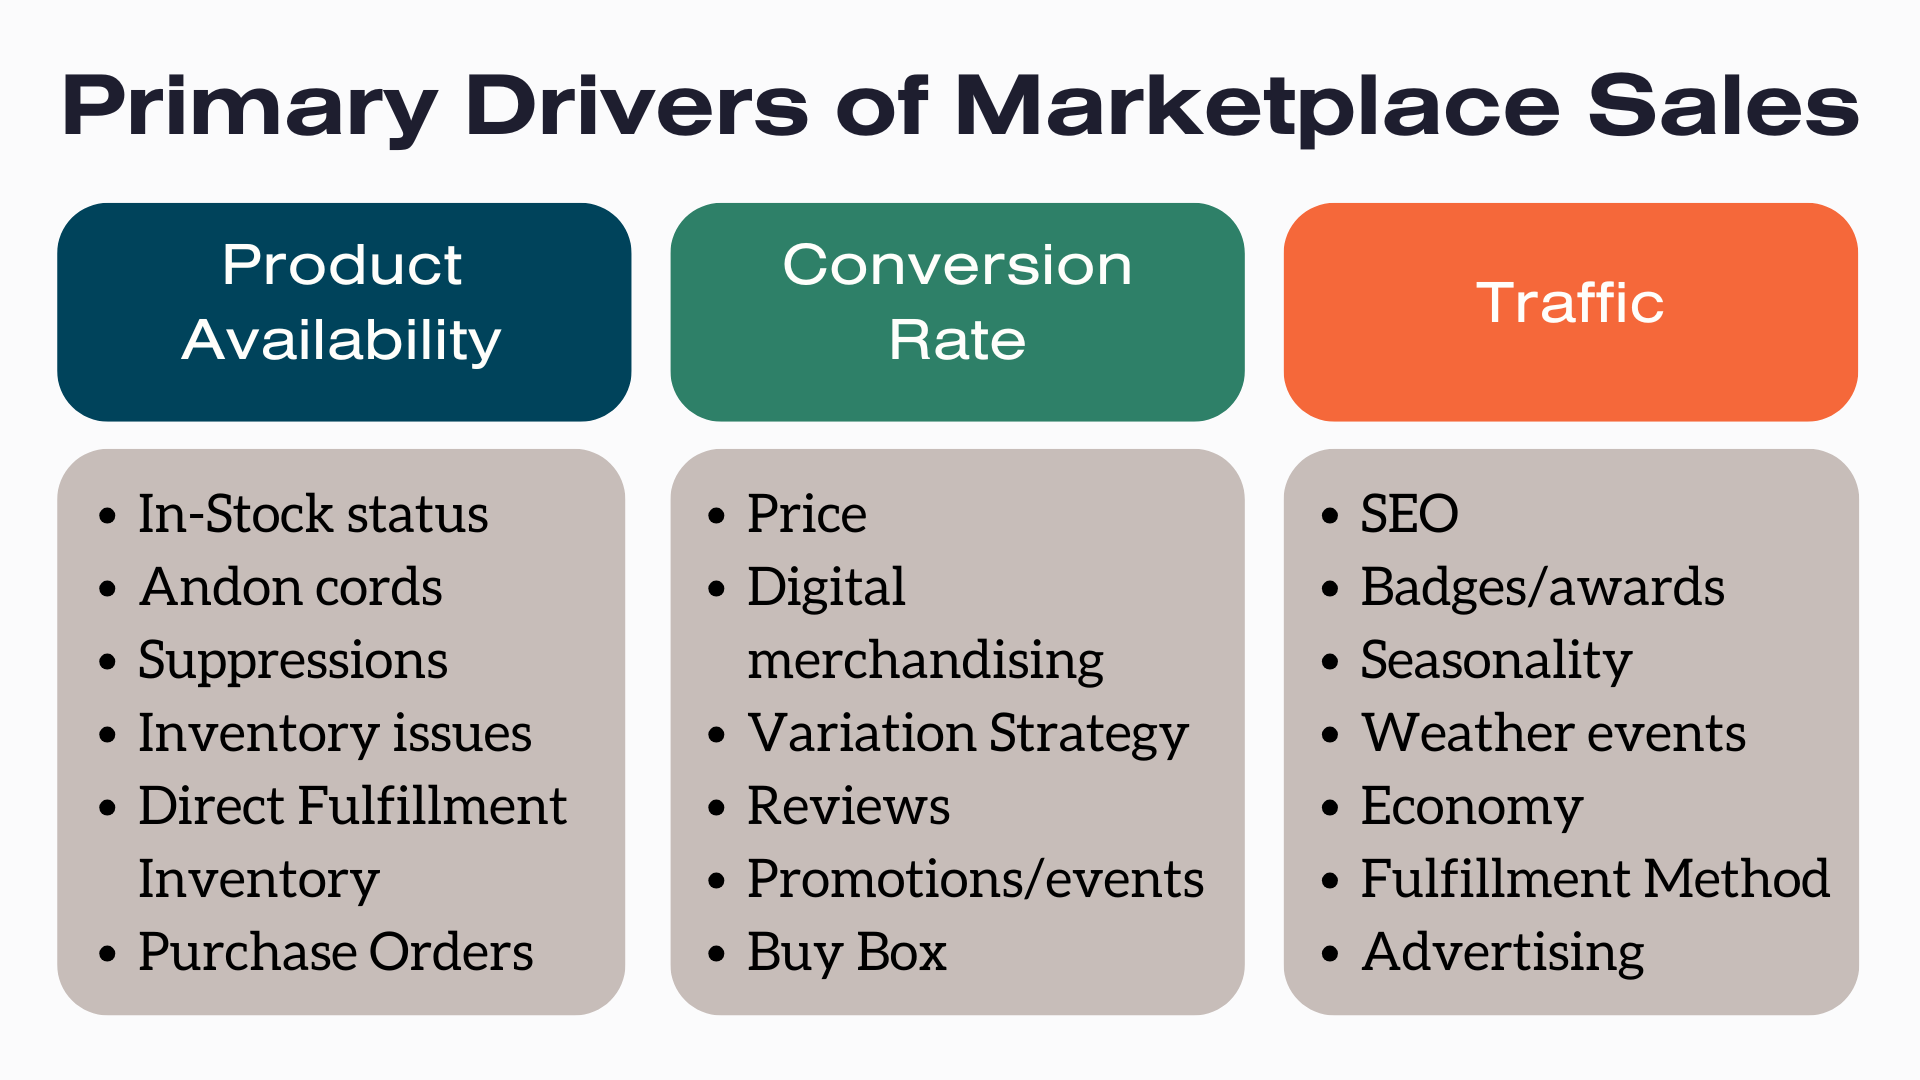
1. Product Availability
Operationally and with forecasting, we are always asking the question: “is the product available to consumers where they want it?” This seemingly simple fact is often overlooked due to the noise created, especially by multiple markets.
Factors that impact product availability include:
- In-Stock status
- Andon cords
- Suppressions
- Inventory issues (eg: product in transit not available or lost/damaged)
- [Amazon Vendor Central] Metrics like Availability Status, Purchase Orders, and Fulfillment Rates
- Direct Fulfillment Inventory
2. Conversion Rate
When a consumer lands on your product page, do they make a purchase decision?
Factors that influence conversion rate include:
- Price
- Digital merchandising (copy, images, A+ Content)
- Advertising (relevant keywords?)
- Reviews
- Promotions/events
- Competitive offerings
- Delivery promise/shipping speed
- Seasonality
- Variation Strategy
- Buy Box
3. Driving High –Quality Traffic & Engagement
Getting eyes to your product page is the third pillar to marketplace success.
Factors influencing whether your product pages drive high –quality traffic & engagement are:
- Marketing
- Keyword optimization/SEO
- Search volume/category popularity
- Competitors’ popularity
- PR events/social media
- Badges/awards
- Event participation
- Seasonality
- Weather events
- Economy/purchase propensity
- Fulfillment Method (eg: Amazon FBA or FBM)
- Category organization
- Variation Strategy
These 3 drivers are at the core of our consulting & strategy consideration. We ensure all levers are pulled on behalf of the brands we work with to drive consumers to purchase. Our goal in partnership is to identify any limiting factors and deliver actionable ideas for continuous improvement. If interested in exploring what a partnership with Brandwoven could look like, reach out to us to book a complimentary consultation.
Best Tools for Ecommerce Marketplace Data Analysis
Various tools can be used to review your marketplace data to identify the root cause of performance changes. Some of the best tools we recommend for marketplace data analysis are:
- Business reports
- Amazon’s VC Retail Analytics report
- Standard reports you can find in the Amazon Seller Central portal
- Pacvue
- Metrics like Share of Voice and Repeat Purchase Behavior
In addition to the above tools, Brandwoven has our own proprietary data analytics platform, Scout. Our platform allows the brands that we partner with to:
- Compare marketplace data across different periods or years
- View Waterfall charts to see overall up/down trends and their breakdown by percent
- Create categories and subcategories to customize summary reports
- Filter by ASIN for a deep dive into a specific product’s sales performance

Step 3 of Ecommerce Marketplace Data Analysis: Driving Action
Once you understand the “what” and “why” behind fluctuations in your marketplace performance, it’s time to take action. The level of action that you can take will be limited depending on whether it’s impacted by something that your brand has control over.
Factors Within Your Control
If you’ve uncovered that a change in your performance is impacted by something you can control (eg: variation strategy), create a plan that covers both short-term fixes (what you can change NOW) and long-term strategies (how your brand can maintain control over time).
Also consider other areas where the same problem could arise later. In the example of poor variation structure, your brand may benefit from reviewing other product detail pages to see if those should also be updated with a better parent/child variation.
Factors NOT Within Your Control
If you’ve discovered that the change is impacted by something you can’t control (eg: seasonality or weather events), ensure that the data clearly shows why it’s happening and its impact. Then, make recommendations for how your brand can improve, identifying what can be changed to contribute to a fix.
For example, if a Vendor Central product is selling slower than usual due to a price increase, suggest that a reseller reduces their price so that Amazon will follow. At the same time, your brand can work on improving SEO keywords or testing alternative text to help improve organic visibility and conversions.
Run Tests Before Making Assumptions
Before assuming that there is an issue outside of your control, run a few tests. It’s better to assume that you can control the situation and test taking steps to resolve the cause of change and potentially fix the issue rather than just “letting it go”. There is always something that can be tested to make incremental progress, even if the root cause you identify seems to be outside of your brand’s control. This testing methodology is key to proving the “why”. There will always be new competitors entering the marketplace, other brands winning market share, and additional factors outside of your control – but there is always something you can test to incrementally improve performance.
Key Takeaways
- Effective marketplace strategy requires analyzing data to determine “what” is happening.
- Investigate the “why” by examining primary sales performance drivers (product availability, conversion rate, and traffic).
- Leverage the best data analysis tools at your brand’s disposal to explore insights and guide you to taking informed actions.
- Continually test and iterate to identify root causes, implement solutions, and drive continuous improvement in marketplace performance.